

Interactive Transportation Improvement Program (TIP) - Community Remarks
[layerslider_vc id=”4″]

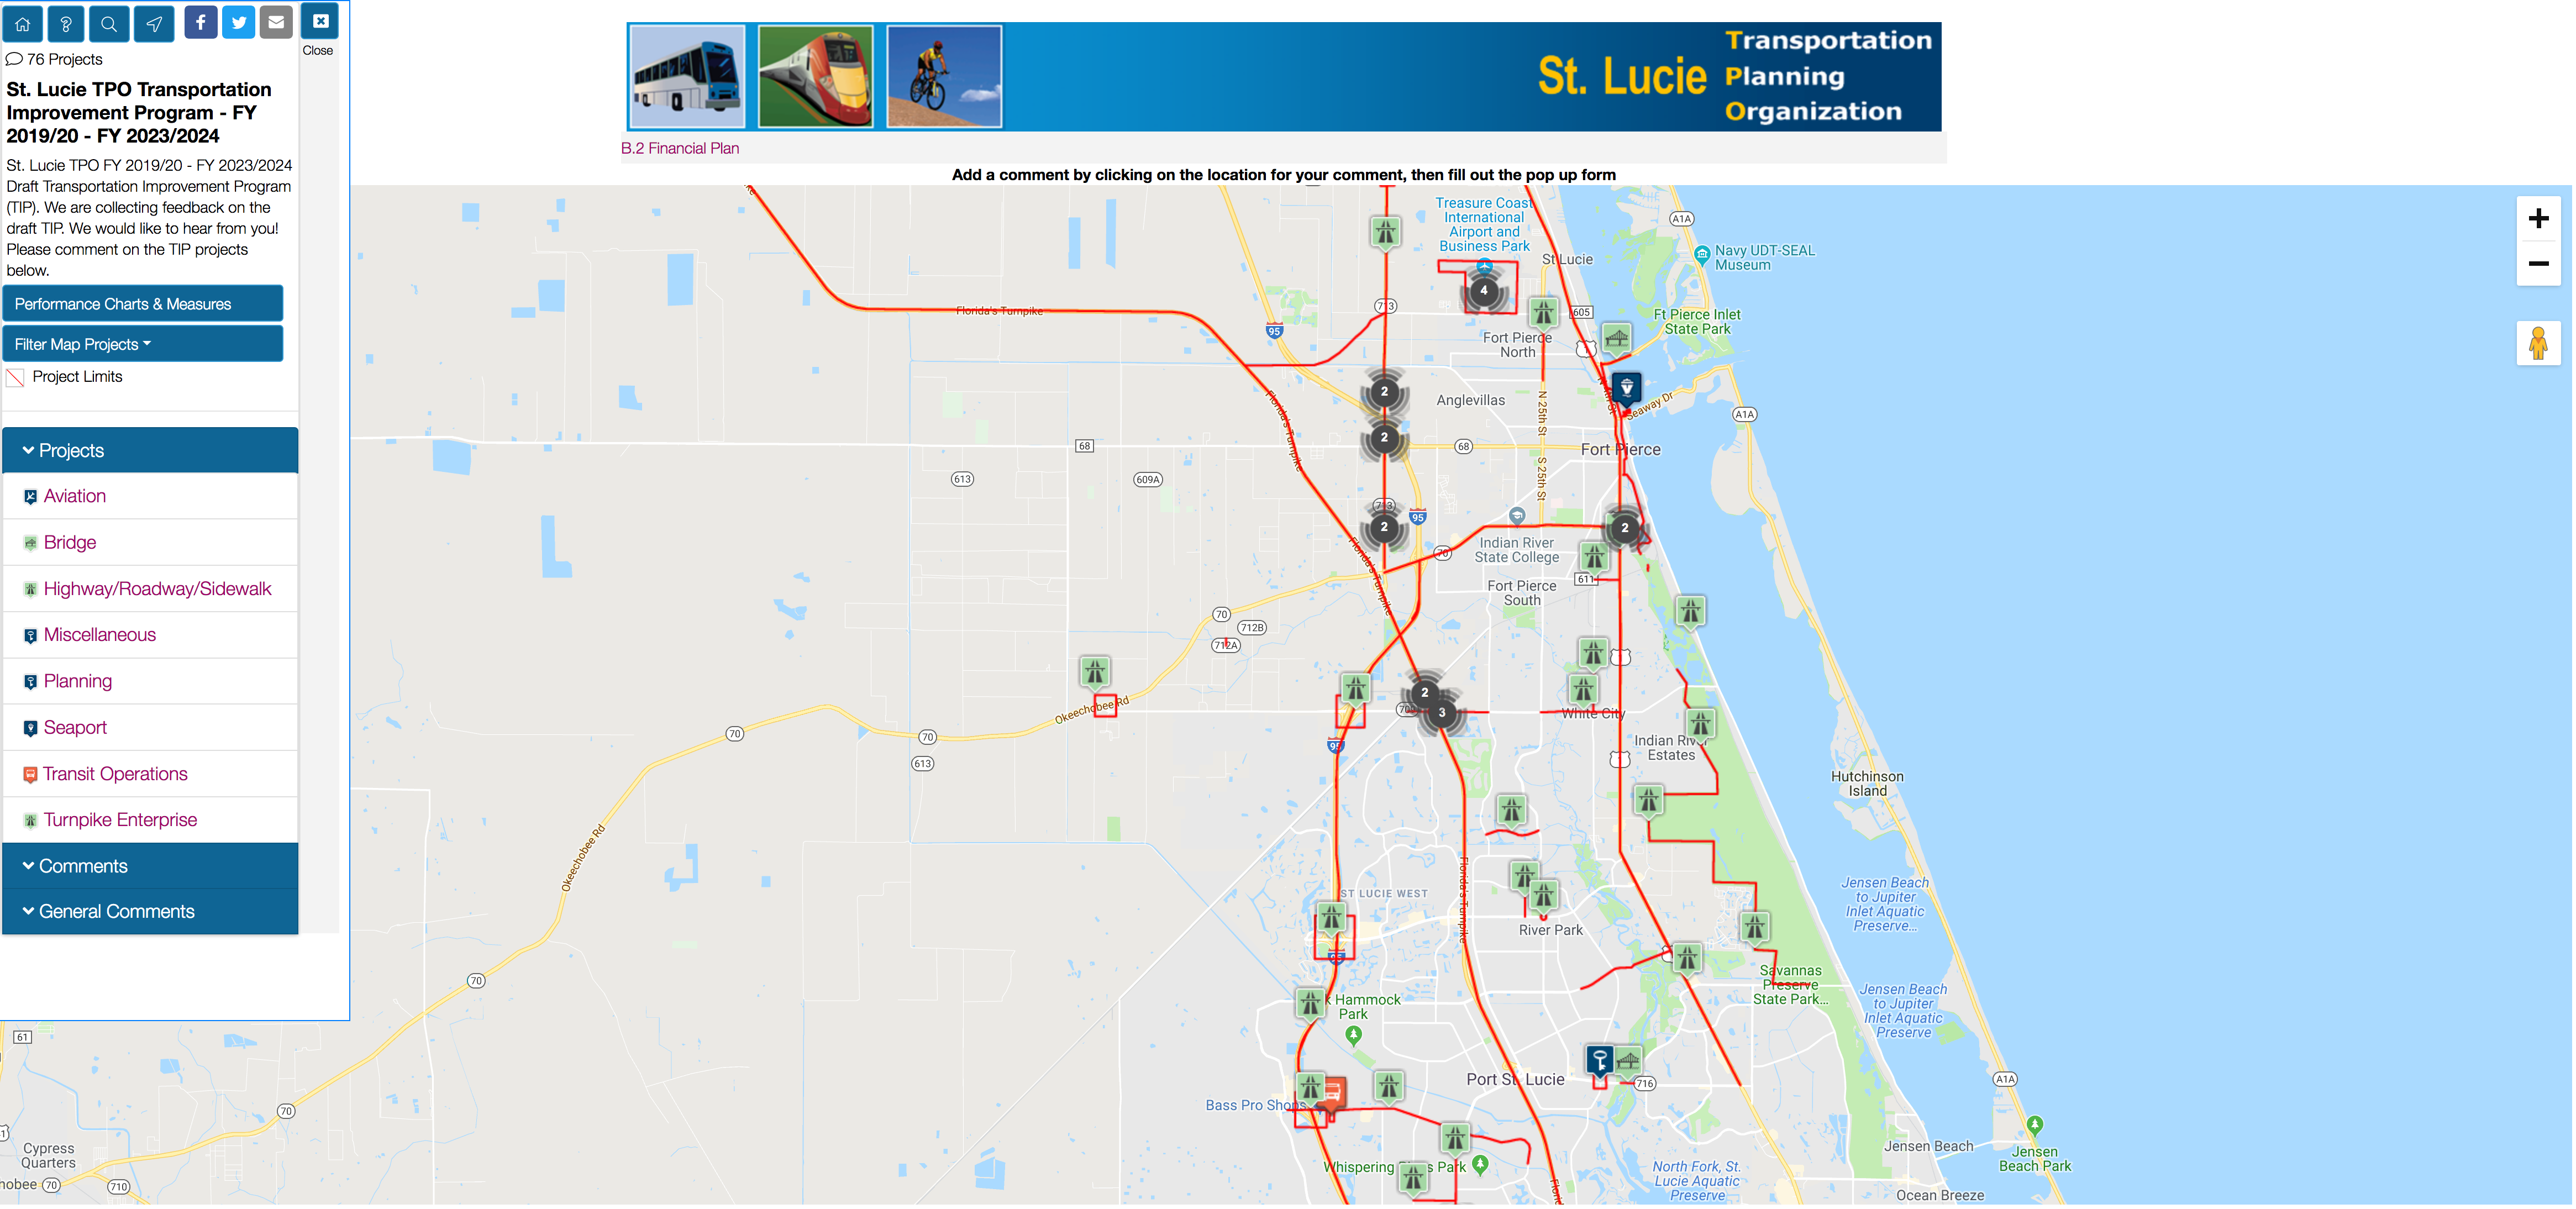
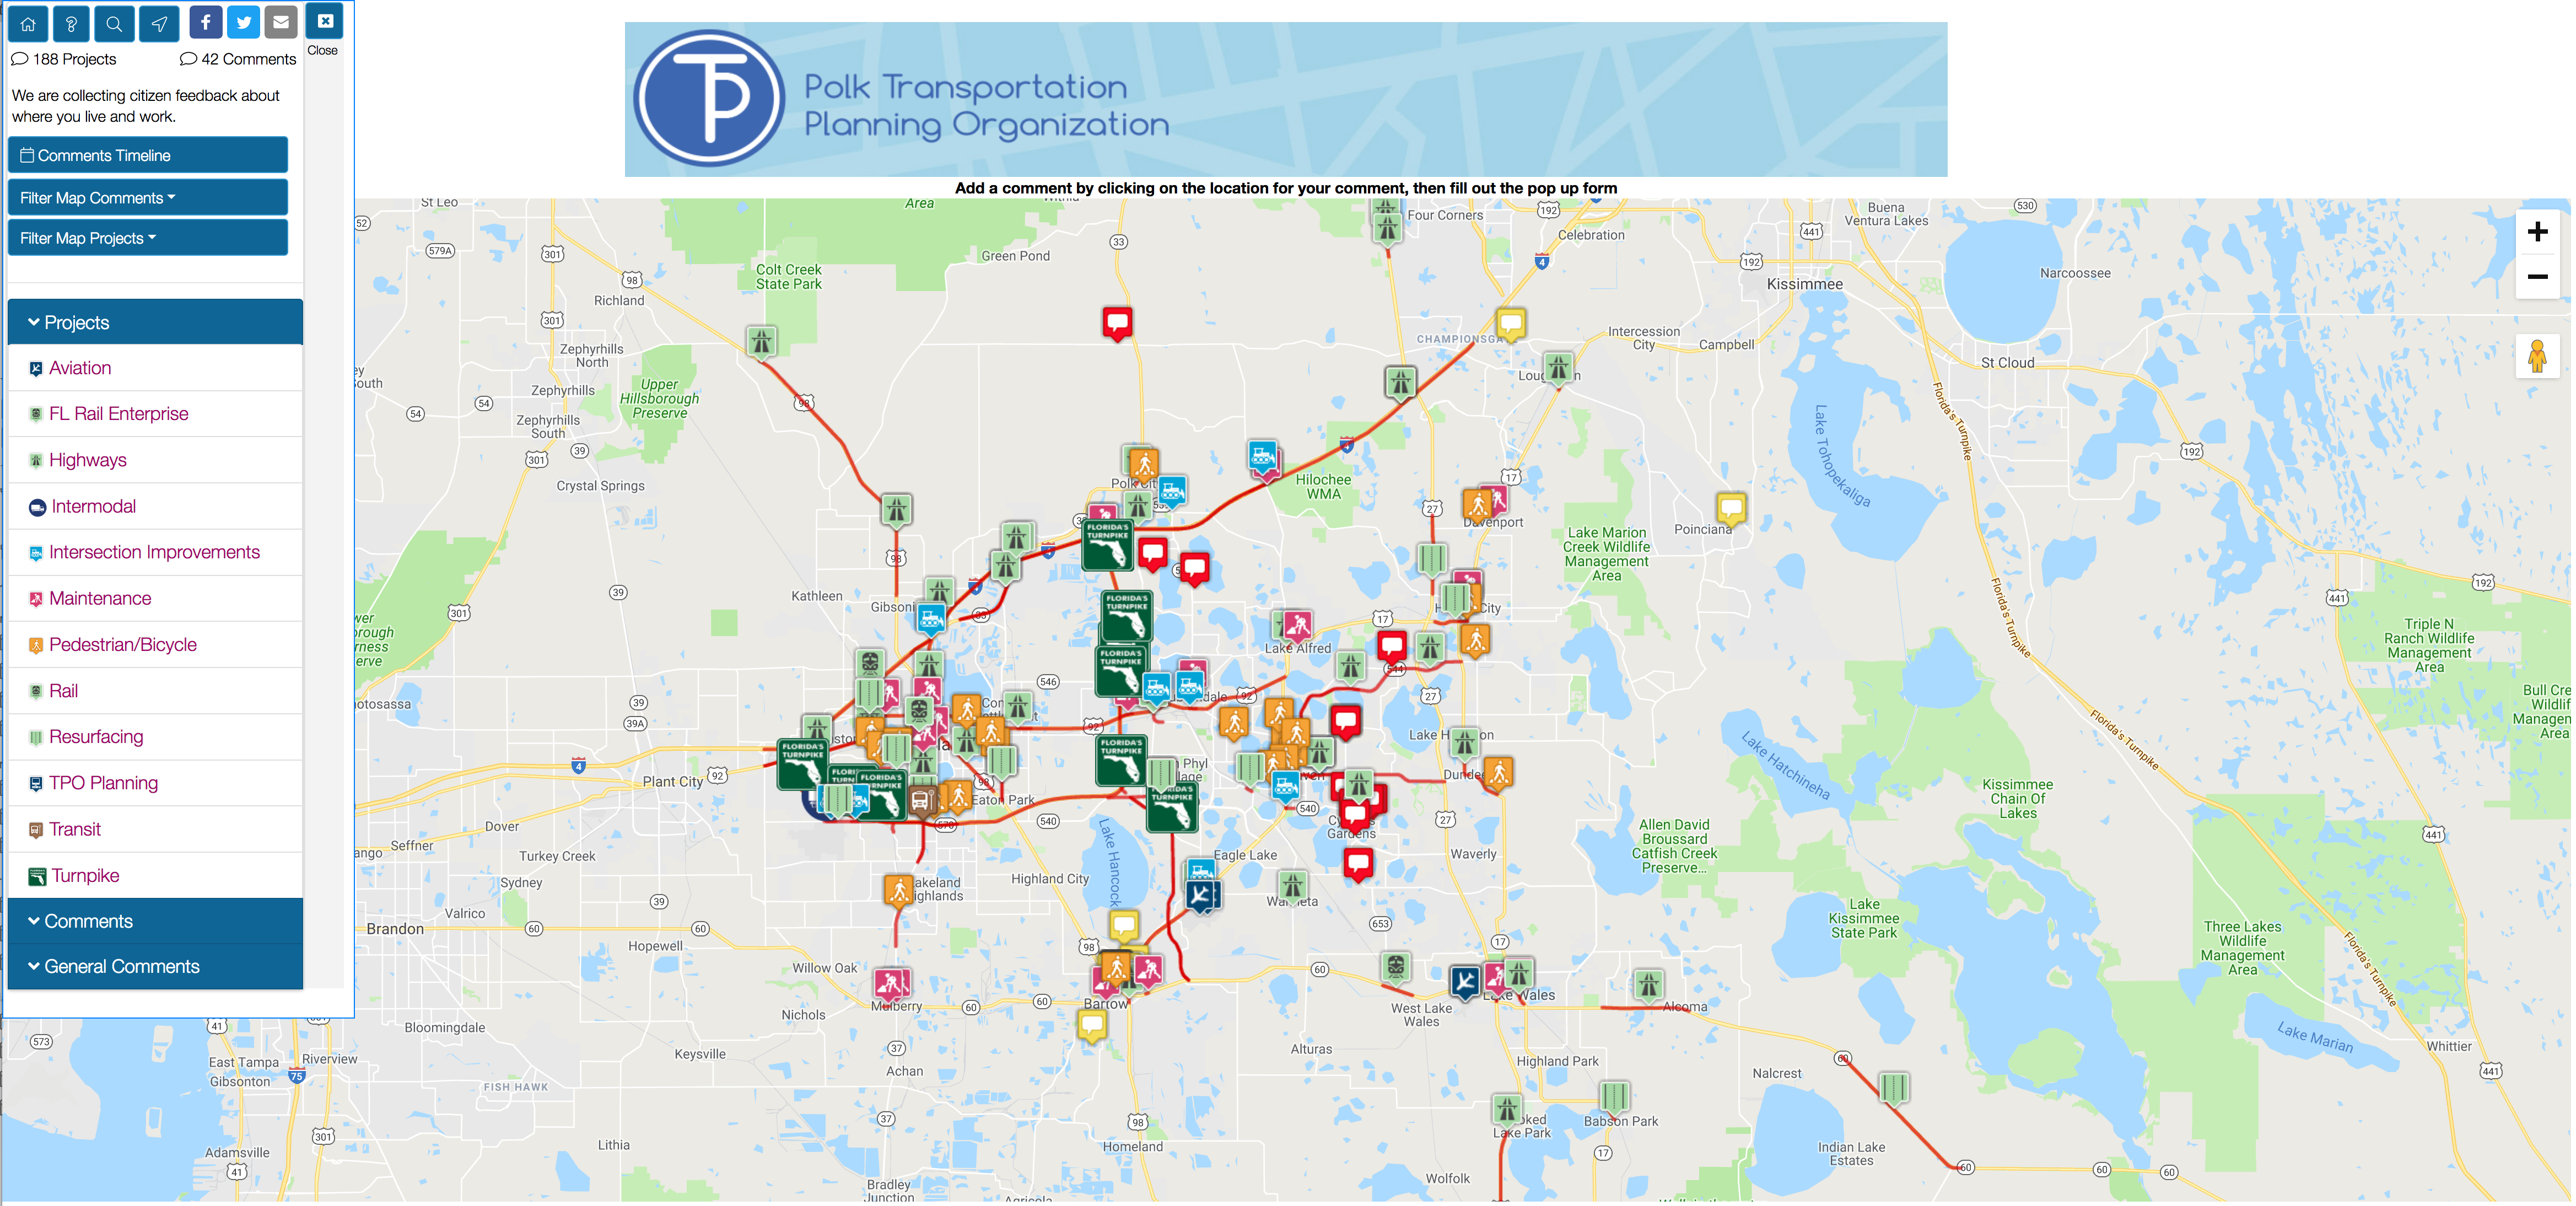
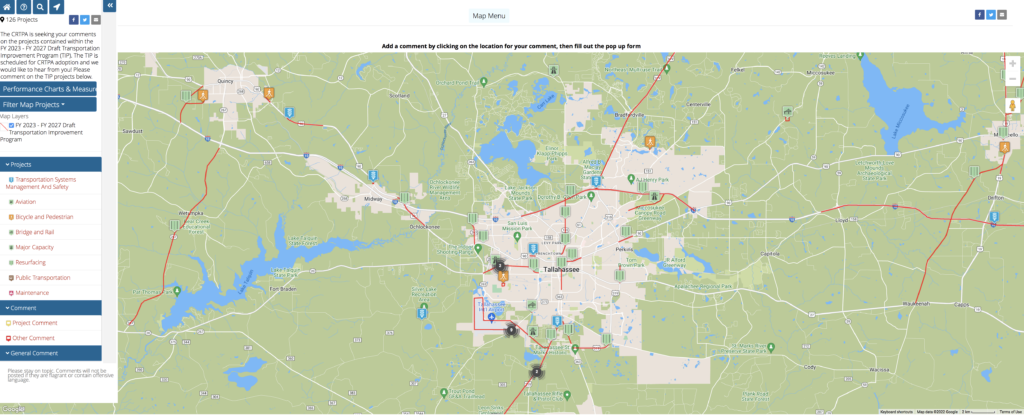
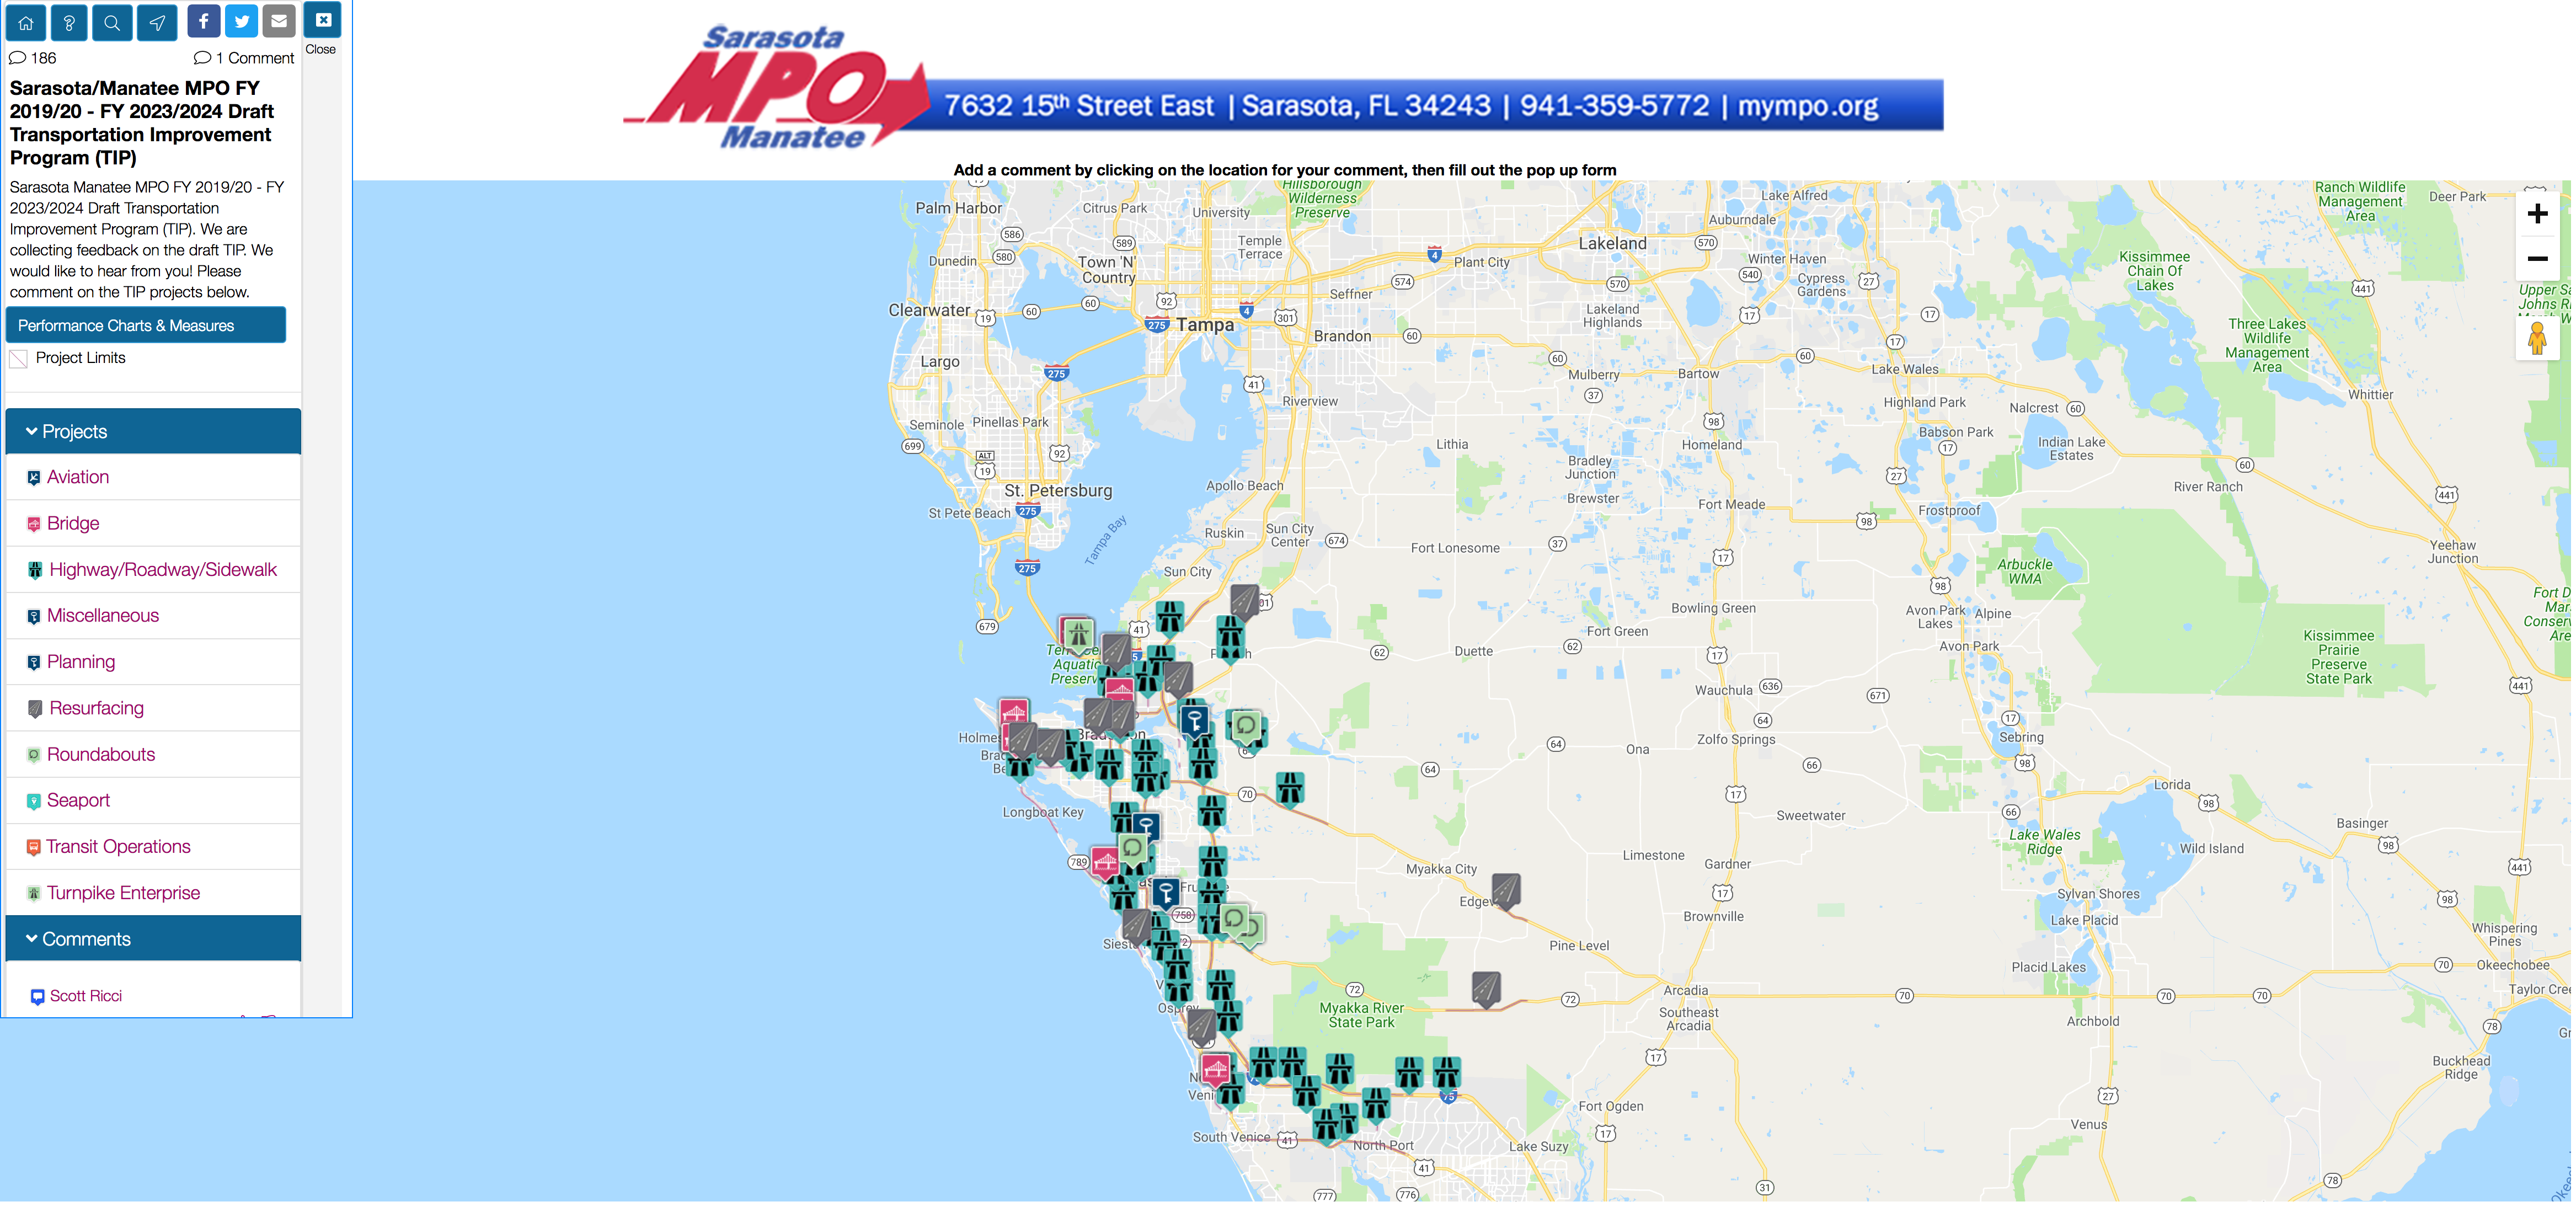
Engage your community to receive direct feedback on funded projects in your TIP. Solicit feedback on projects and opportunities. Generate your entire TIP document from COMMUNITY REMARKS, which dynamically adds your performance measures and citizen feedback in the report!
Import Project Data
Import projects from DOT download. We setup and import all your data.
LRTP projects can be added as a layer on the map.
Display
Display projects on a user-friendly Google map, project details page, in fiscal constraint tables, and performance measures.
Manage
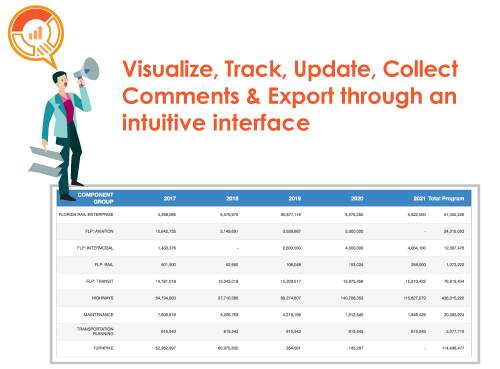
Add database fields, track amendments and updates, and generate fiscal constraint tables: financial plan, fund summary, funding source estimates, funding by component group.
We assist you by setting up all the pages in your TIP. Content is added through a user-friendly interface you can update. Generate a PDF of all pages in a couple of steps.

Expand your interactive TIP capabilities
COMMUNITY REMARKS makes it easy to manage your transportation
improvement program and solicit feedback on projects.
- Present projects on a user-friendly map and detail page
- Search by work mix, fund source, responsible agency, and description
- Collect citizen comments and votes during your commenting period
- Quickly respond to comments directly from the admin
- Print projects in landscape or portrait orientation
- Update and expand project fields from the admin
- Generate tables: fiscal constraint, financial plan, fund summary, funding source estimates, and funding by component group
Let's Talk Performance Measures

 We have a goals chart on the home page that shows total number of projects, TIP total funding, and projects related to goals you create. This chart is generated on-the-fly when you turn it on.
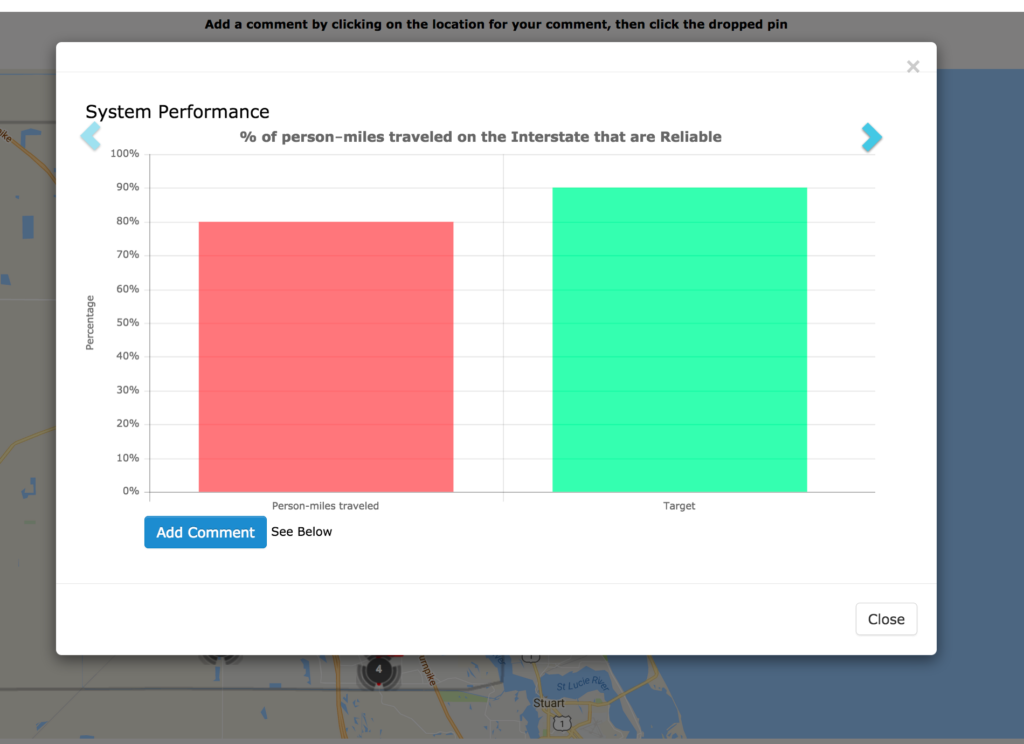
The performance measures and targets button brings up all performance measures charts you setup. You must purchase the performance measures module for this to be enabled. In the admin, you can create an unlimited amount of charts, which will be auto-generated on specified pages in printed TIP.
Create
Create a performance measure, insert the values and target.
Integrate
Display on the website and dynamically add them to your TIP’s Appendix.
Update
Add new measure values to show performance measures spanning multiple years.
FAQs
How are projects inserted into Community Remarks?
We prepare the spreadsheet of projects provided by DOT. We setup and insert projects into the system.
How long does it take to go live?
Once projects are inserted into Community Remarks, it is ready to go live. Generating the report requires pages to be created in the back end. It is highly recommended that you setup your pages and insert your narrative as soon as possible. This will ease the flow of the TIP document process.
How do I generate the report document?
We will provide you with a one hour tutorial on how to setup pages in the admin. Sections are created and linked to pages. Inside each page, you can copy/paste text, upload images, attach specific fiscal constraint tables which are generated dynamically from the DOT spreadsheet. This will make it very easy for you to generate your future TIP documents by only having to change a few pages each year.
Project pages are generated on-the-fly. Each category of projects can be exported as a PDF with page numbers.
It is best practice to setup your TIP sections and pages before you need to print out the document. The initial setup takes the longest to get all your content into the system.
How do I create performance measures and targets?
We provide a tutorial on how to manage performance measures. An entire section of the admin is devoted to performance measures. If you purchase this module, you will have access to it. There, you will be able to create a performance measure graph with as many values as you desire. You can add new values each year enabling you to show change over time each year.
Why is Community Remarks for TIP billed annually?
Every year we have a new version of the TIP (unless you are on a bi-annual basis in that case you will only need to pay the web hosting fee). We version control your interactive TIP and you need our technical support to get the new version into the system. We estimate 25 hours of our time. Building this into the pricing enables us to schedule and provide the assistance you need to get your TIP ready on time.
Every year, we are adding new features to the software so that it never grows stale. Has your current interactive TIP software changed much over the years? We are not going to set it and forget about it every year. We are always striving to utilize cutting edge web tools to present your TIP to the public in the most user-friendly and relevant manner.
How do I display project limits lines on the map?
GIS data is exported in KMZ file format and added to the interactive map. We also extract KMZ data and insert it into the database for the purpose of printing high-resolution maps.
Does Community Remarks have the capability to turn commenting off?
Yes, you can close commenting at any time.
Can we display additional information that is not in the DOT spreadsheet?
Yes. Send us a spreadsheet of the additional information you want to add to the system and we will merge and upload it into the database.
Can the LRTP by shown on the map too?
Yes, LRTP can be shown as a layer on the map by uploading KMZ files of your projects.
Basic +Plus for TIP
DOT projects & fiscal constraints
*$7,000+
annual
Includes up to 25 hours of technical support
- Pricing varies depending of level of support
- Extensive support provided to import DOT spreadsheets
- Customized templates designed specifically for a TIP
- Search by work mix, fund source, responsible agency, and description
- Fiscal Constraint tables
- Automatically archives completed projects
- Print projects in landscape or portrait
- Update and expand project fields from the admin
*Pricing is for geographic areas consisting of 650,000 people or less. Larger areas might require purchasing additional technical support.
Performance Measures Module
Track & Display Performance Measures & Targets
$995
annual
- Create an unlimited number of measures and targets
- Choose from a variety of chart types
- Add unlimited measures per chart
- Auto-generate chart pages for the TIP document
- Link projects to goals
- Collect comments on measures & targets
Web Hosting
Renewed Annually
$420
annual
Web hosting is renewed annually. Support includes a live person reading every comment, the never ending process of fighting spam and upgrades/updates.
Customization and additional support beyond the license fee technical support provision for the first year is provided as-needed at $150/hour. Additional fees will be provided in a project scope.